Install InfluxDB and Grafana on Raspberry Pi
Many Internet of things projects based on the Raspberry Pi need to save time series data on a database and need an interface to view stored data.
InfluxDB and Grafana are the the perfect tools to do the job.

What is a Raspberry Pi?
The Raspberry Pi is a low cost, credit-card sized computer capable of doing everything you’d expect a desktop computer to; what’s more, the Raspberry Pi has the ability to interact with the outside world using the 0.1” spaced 40-pin GPIO header.
Given the size and the GPIO access (27 GPIO, UART, I2C, SPI as well as 3.3 and 5V sources), the Raspberry Pi has been used as embedded computer in a wide array of digital maker and internet of things, projects. [ 1 ].
The Raspberry Pi model used in this guide is Raspberry Pi 2 Model B with Raspbian.
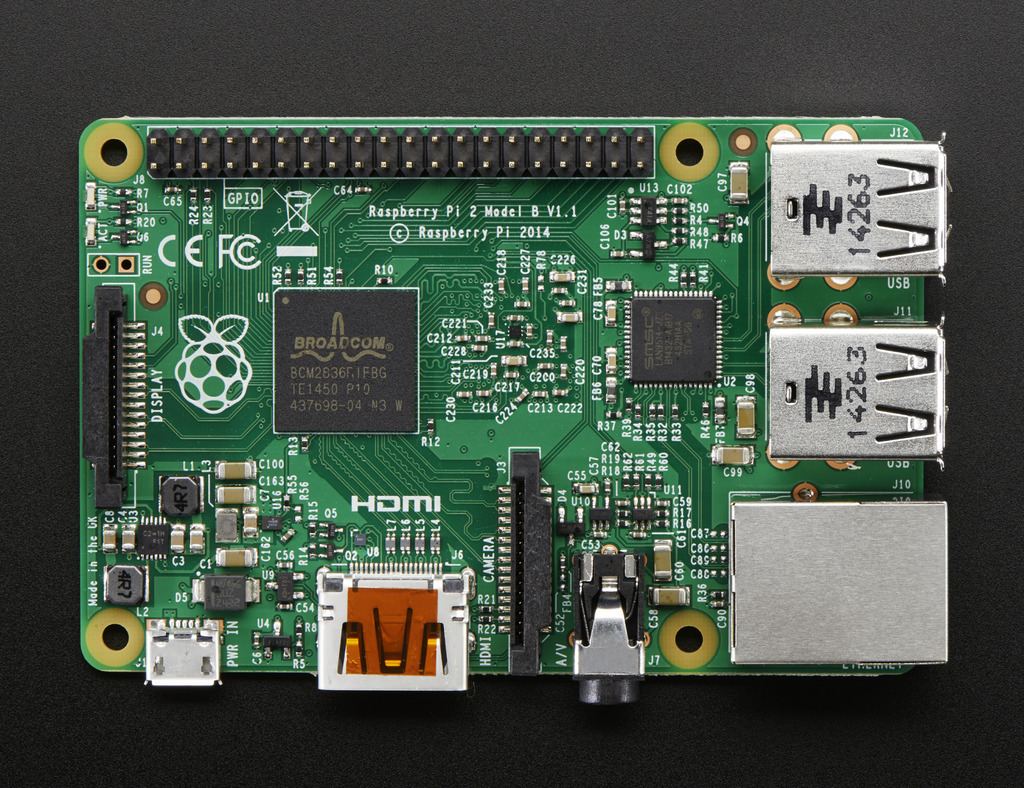 Image courtesy of Adafruit, (CC BY-SA 3.0).
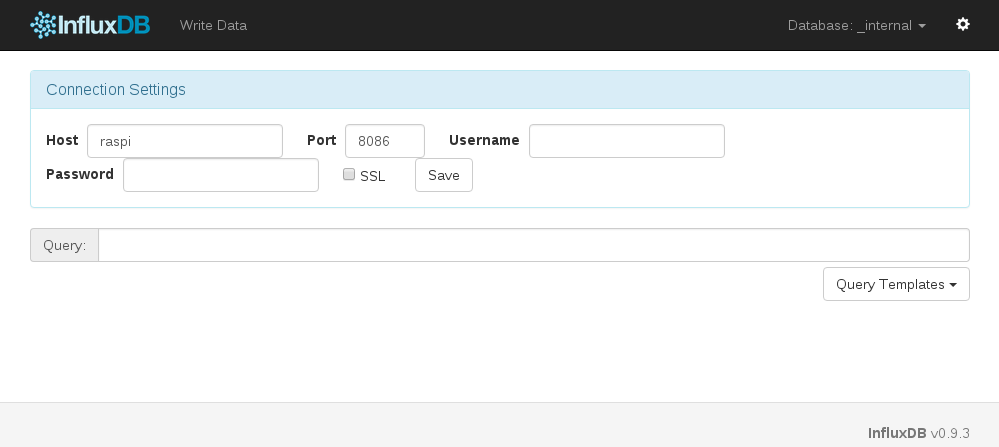
What is InfluxDB?
InfluxDB is a time series, metrics, and analytics database. It’s written in Go and has no external dependencies.
InfluxDB is targeted at use cases for DevOps, metrics, sensor data, and real-time analytics. [ 2 ]
Key Features: [ 2 ]
- SQL-like query language
- HTTP(S) API for data ingestion and queries
- Built-in support for other data protocols such as collectd
- Store billions of data points
- Tag data for fast and efficient queries
- Database-managed retention policies for data
- Built in management interface
- Aggregate on the fly
- Store and query hundreds of thousands of series, filtering by tags
- Merge multiple series together
InfluxDB requires Go 1.5 or greater.
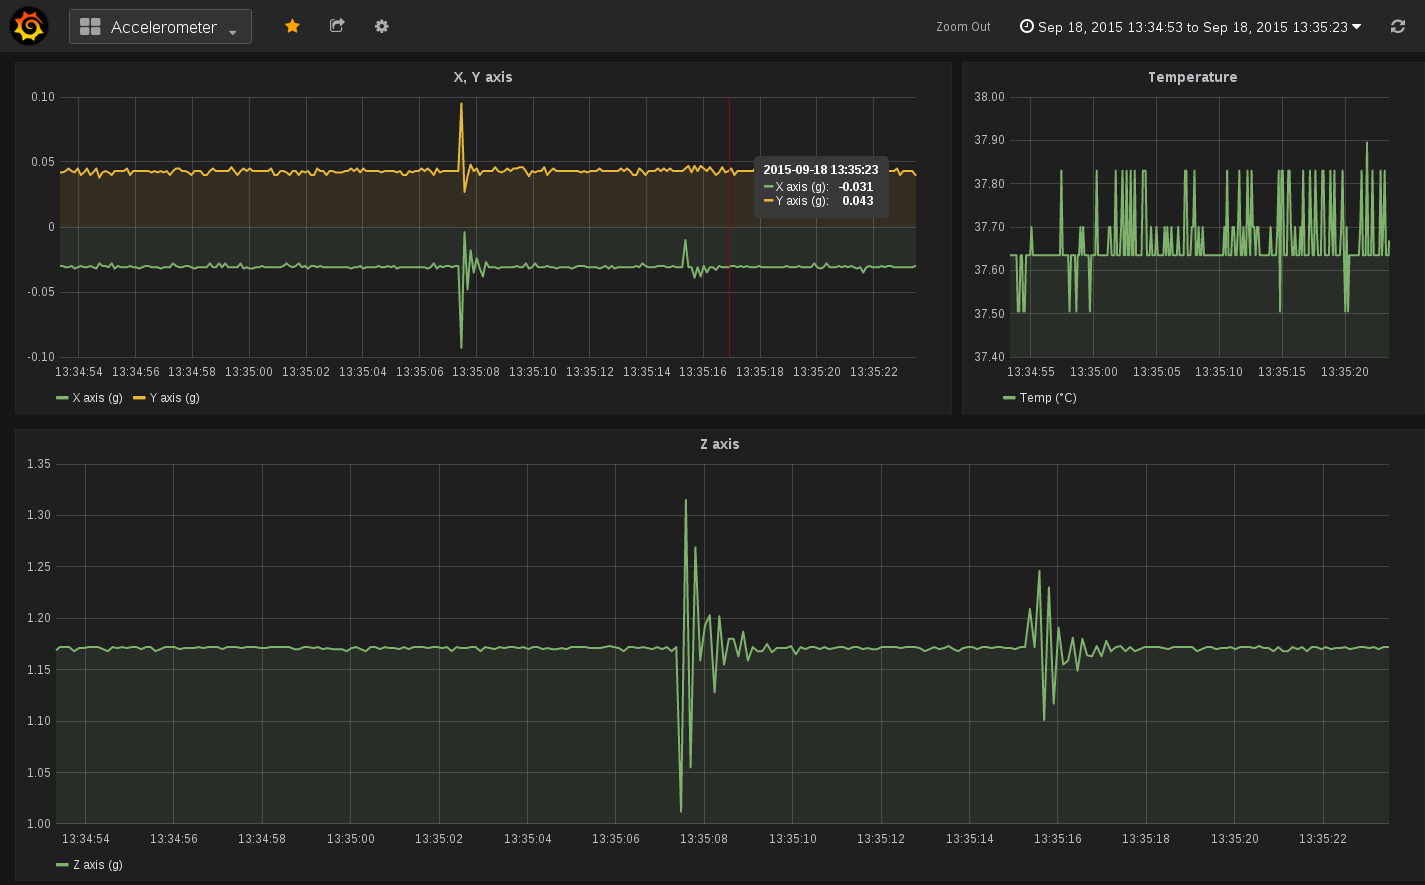
What is Grafana?
Grafana is a leading open source application for visualizing large-scale measurement data.
It provides a powerful and elegant way to create, share, and explore data and dashboards from your disparate metric databases, either with your team or the world.
Grafana is most commonly used for Internet infrastructure and application analytics, but many use it in other domains including industrial sensors, home automation, weather, and process control. [ 3 ]
Grafana requires Go 1.4 and NodeJS.
Install requirements
Install Go
InfluxDB requires Go 1.5 but to install Go 1.5 you need Go 1.4 (see this issue).
GVM provides an interface to manage Go versions.
# requirements
sudo apt-get install curl git mercurial make binutils bison gcc build-essential
# install gvm
bash < <(curl -s -S -L https://raw.githubusercontent.com/moovweb/gvm/master/binscripts/gvm-installer)
source /home/pi/.gvm/scripts/gvm
# install go
gvm install go1.4
gvm use go1.4
export GOROOT_BOOTSTRAP=$GOROOT
gvm install go1.5
gvm use go1.5 --default
Install NodeJS
Grafana requires NodeJS to build the front-end assets using Grunt.
Adafruit has a good guide about NodeJS on Raspberry Pi.
# add the apt.adafruit.com package repository to your Pi
curl -sLS https://apt.adafruit.com/add | sudo bash
# install node.js using apt-get
sudo apt-get install node
Install InfluxDB
Based on “Contributing to InfluxDB”.
# getting the source
go get github.com/influxdb/influxdb
# install
cd $GOPATH/src/github.com/influxdb
go get -u -f -t ./...
go build ./...
# start influxdb
$GOPATH/bin/influxd
Install Grafana
Based on “Building Grafana from source”.
# getting the source
go get github.com/grafana/grafana
# building the backend
cd $GOPATH/src/github.com/grafana/grafana
go run build.go setup
$GOPATH/bin/godep restore
go run build.go build
# build the front-end assets
npm install
sudo npm install -g grunt-cli
grunt
# start grafana
$GOPATH/bin/grafana
Start Your Engines!
# start influxdb
$GOPATH/bin/influxd
# start grafana
cd $GOPATH/src/github.com/grafana/grafana
$GOPATH/bin/grafana